
Seasonal Pricing Patterns: How Retail Calendars Affect What You Pay
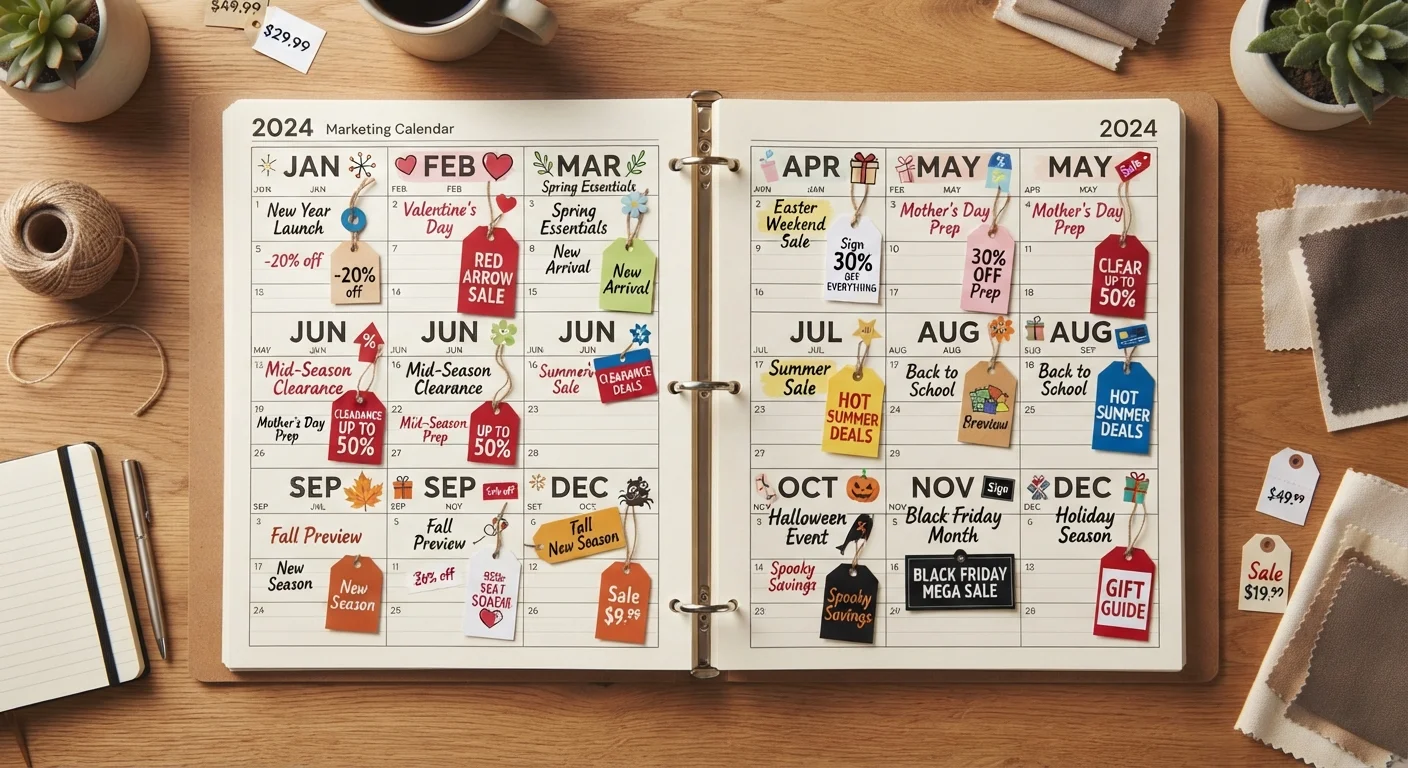
Photo credit: TrendingExperts.net
In this article
Prices follow predictable rhythms tied to retail seasons, inventory cycles, and holidays. Understanding these patterns can inform smarter timing.
How Retail Seasons Drive Price Cycles
Retail prices are not random. They follow well-documented rhythms tied to inventory cycles, manufacturer model-year schedules, and consumer demand peaks. Understanding these patterns won't guarantee savings, but it gives you a more honest picture of when a discount is genuinely driven by inventory pressure versus when it's a marketing construct.
Most retail pricing operates on two key pressures: demand-side peaks (holidays, back-to-school, summer) when retailers hold prices firm or raise them, and supply-side clearance windows (end of season, model-year changeovers, post-holiday) when markdowns tend to be more structurally real. The distinction matters because a 30% discount off an inflated pre-holiday price is not the same as a 30% clearance cut driven by a retailer that needs warehouse space.
For a deeper look at how anchoring and fake reference prices are used to make those percentages look more impressive, see our guide on retail pricing tricks that inflate markdowns.
| Post-holiday clearance window | Typically January 1-mid-February (General retail industry pattern) |
| Back-to-school demand peak | Late July through mid-August (National Retail Federation data, general) |
| Holiday price inflation risk | Highest October-November for gift electronics (General retail pricing observation) |
| Outdoor/patio clearance window | Typically August-September (General retail industry pattern) |
| Winter apparel clearance | Deepest discounts: late February-March (General retail merchandising cycle) |
| Holiday seasonal décor clearance | Begins December 26 (General retail industry pattern) |
Key Pricing Windows Across the Calendar Year
While timing varies by category, a few windows consistently produce structurally lower prices rather than cosmetically inflated discounts:
- January-February: Post-holiday clearance on electronics, apparel, and home goods. Retailers need to clear Q4 inventory before spring restocking. Discounts in this window are often inventory-driven, not promotional theater.
- Late February-March: Winter apparel hits deep clearance. Gyms and fitness gear see elevated prices in January when demand peaks, then soften by March.
- May-June: Appliance and mattress promotions tied to Memorial Day are common, but verify whether the sale price represents a genuine departure from the typical price using historical price data tools.
- July-August: Back-to-school demand raises prices on laptops, backpacks, and supplies. Outdoor and patio furniture, however, tends to reach clearance pricing as summer winds down.
- October-November: Pre-holiday demand causes price increases on popular gift categories. The widely marketed sales events of late November are worth scrutinizing - some items are legitimately discounted, while others follow the pattern described in our piece on how markdowns are made to look bigger than they are.
- December 26 onward: Gift wrap, seasonal décor, and leftover holiday inventory drop sharply. This window is one of the more reliable clearance periods across categories.
Clearance pricing
Price reductions driven by a retailer's need to clear existing inventory, often to make room for new stock. Clearance markdowns tend to be structurally real rather than promotional constructs.
Demand-side peak
A period when consumer demand for a category is high, giving retailers less incentive to discount. Prices during these windows often hold firm or rise.
Reference price
The "original" or "regular" price a retailer displays alongside a sale price to make the discount look significant. Reference prices can be inflated or selectively chosen to exaggerate savings.
Model-year changeover
The period when a manufacturer introduces a new product version, prompting retailers to discount the outgoing model to clear inventory. Common in electronics and automotive categories.
Price history
A record of how a product's price has changed over time. Comparing a current sale price to its price history helps determine whether a discount is genuine.
What Seasonal Pricing Doesn't Tell You
Calendar patterns are a starting point, not a guarantee. Several factors can disrupt typical cycles: supply chain disruptions, inflation, category-specific demand shifts, and individual retailer strategies. A product category that historically softened in January may behave differently if demand has spiked due to a trend or shortage.
Seasonal patterns also don't account for the way promotional framing can obscure what's actually happening with price. A retailer can run a "seasonal sale" in any month simply by inflating the reference price first. This is why price history matters alongside calendar awareness - the two tools work together. Our coverage of what price tracking tools actually do and don't do explains how to use that data responsibly.
It's also worth watching for what happens after you identify a deal. Minimum spend requirements, add-on nudges, and tiered shipping costs can erode savings you thought you'd locked in. See our explanation of why cart totals keep climbing after a great deal for a breakdown of those mechanisms.
The most reliable approach is to treat calendar patterns as contextual evidence - one input among several - rather than a definitive signal that a price is genuinely good.

Author
Shopping Editorial Team
Shopping Editorial Team is the collective byline for our editorial team and contributor network. Articles published under this byline or an editorial pen name are researched, written, and reviewed according to our editorial standards for clarity, consistency, and independence before publication.
View all articles →